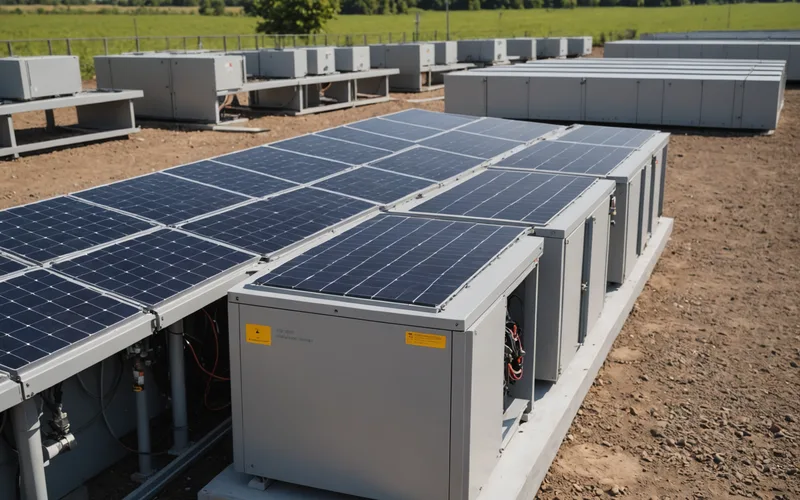
A mid-size solar plant with 15 central inverters can generate 2,000 to 4,000 SCADA status events each day. Many are harmless: grid frequency events that clear within seconds, temperature warnings that disappear as afternoon ambient conditions change, and reactive power regulation events from the grid operator. The difficulty is that an early failure signal can look just like a dozen benign events already logged that day. Teams then either respond to everything, which is exhausting, or batch alerts for weekly review, allowing developing faults to become full outages.
As we build Solarvyew, we return to one question: which signals come before hardware failure, and which simply reflect normal operating variance? Those require different monitoring approaches.
Inverter Telemetry: What You Have and What It Reveals
Most string and central inverters report a shared core of variables: DC input voltage and current for each MPPT channel, AC output voltage and current per phase, power factor, cabinet and heat sink temperature, fan status, and a fault register. Central inverters commonly add transformer temperature and, in liquid-cooled models, sometimes coolant flow.
Many of these readings are state variables, not trend variables. A fan fault is binary: present or absent. It is easy to monitor, but offers no advance notice. Heat sink temperature is different. It is continuous and can provide useful predictive information. If an inverter heat sink remains 12 degrees above its peers on an equivalent-load day for two weeks, that pattern merits investigation before an alarm appears. Possible causes include poor cabinet ventilation, a failing thermal interface, or clogged air filters. These conditions may not enter the fault register until they cause a trip.
MPPT tracking efficiency is another useful signal that standard dashboards often omit. When an MPPT channel oscillates during its maximum power point search instead of converging, the DC current trace shows a characteristic ripple at 15-minute resolution. The pattern can point to capacitor bank or control firmware issues and generally appears weeks before a more serious failure.
Why Absolute Thresholds Fail on Continuous Signals
The usual method is an absolute upper limit: heat sink temperature above 85 degrees Celsius produces a warning, while above 90 degrees produces a critical alert. It is simple to configure and explain, but it fails in predictable ways.
Ambient temperature changes the meaning of the reading. A heat sink at the same temperature means something different at 15 degrees Celsius ambient than at 42 degrees Celsius ambient. A fixed limit set for summer can create repeated winter false positives. Set it for winter, and genuine summer thermal stress may go unnoticed.
Inverter health is also relative to the unit itself and to its peers. An inverter operating 5 degrees warmer than its two neighbors at the same load point deserves review, even when its absolute temperature remains below the threshold. The relative deviation often says more than the absolute value.
That is why Solarvyew uses fleet-relative baselines instead of fixed limits. For each inverter metric, we estimate the expected reading under the operating conditions, including ambient temperature, load level, time of day, and season. Each unit is then compared with its own history and with similar inverters across the fleet. A deviation two standard deviations beyond both references provides more useful information than any fixed number.
Which Signals Precede Hardware Failure
Among the signals commonly available through utility-scale inverter SCADA, a small group provides most of the predictive value. These are the measures that have been most consistently informative in our early pilot deployments.
Heat sink temperature relative to fleet peers at equivalent load is the most broadly useful. It is available on nearly every inverter, remains continuous, and reveals thermal management decline well before a trip. Clogged filters, degrading fans, and blocked ventilation tend to appear here first.
DC bus voltage stability helps identify capacitor bank aging. A healthy bank keeps the DC bus steady during load transitions. A degraded bank permits transient voltage sag during load steps, visible in a high-resolution current trace. Not every SCADA setup provides this signal, but where five-minute or finer resolution data exists, it merits monitoring.
Reactive power regulation error may point to problems with the grid-side power factor controller. Consistent failure to meet a reactive power setpoint means either reduced reactive power capability or a malfunctioning control loop. Both conditions present risk.
Total harmonic distortion at AC output is sometimes logged and can indicate filter component health when the inverter provides this measurement.
We are intentionally not listing every available signal. More signals do not necessarily add insight; they can add false positives and manual review. The aim is to find the smallest group that gives early notice of important failure modes. For most inverter hardware, that means thermal stress, capacitor degradation, and control system drift.
Structuring Alerts Operations Teams Will Act On
An O&M team receiving 50 alerts per day and closing 45 as false positives within an hour will stop trusting the alert system. This is not hypothetical. We have spoken with operations managers at mid-size asset portfolios who bypassed SCADA alert channels and shifted to weekly manual review because the signal-to-noise ratio had deteriorated too far.
The answer is not more monitoring, but better alert triage. We rank anomalies using a priority score that considers the size of the deviation and the historical reliability of that signal for the inverter type involved. A signal that produces frequent false positives on comparable units under similar conditions is held for pattern confirmation before reaching the operations queue. A historically reliable signal for a given inverter family surfaces immediately.
This problem is not solved once and for all. Scoring needs operating history from the specific fleet, and early deployments always include a tuning period. We tell pilot partners clearly that the first four to six weeks of a new installation create more noise than a mature deployment. That period supports calibration; it is not evidence that the system has failed.
What ML Monitoring Does Not Replace
Even well-tuned continuous telemetry monitoring cannot detect physical degradation that leaves no electrical signature. Mounting hardware problems, wildlife damage, water ingress that has not yet changed electrical performance, and degrading cable insulation before failure will not appear in a current or voltage trace. Physical inspection remains necessary.
Software monitoring does not replace field technicians, and we do not claim that it does. Its value is in changing the nature of field visits: instead of emergency dispatches after a failure, teams can conduct planned inspections based on specific anomaly hypotheses. For O&M teams covering several sites with limited technician availability, better dispatch quality has real operational value. For more on how fault detection connects to broader analytics, see the piece on generation gap analysis.