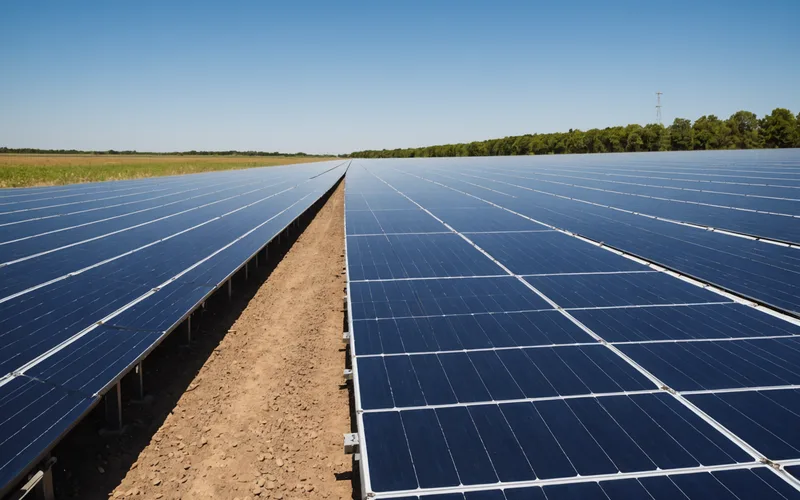
A utility-scale PV plant usually raises a string alarm when current falls 20 to 30 percent below its expected value. At that point, the string has often been operating below capacity for days. The alert confirms a failure, not that one is developing. At Solarvyew, we have been examining whether the signatures that precede a full failure can be detected early enough for an O&M team to schedule a response instead of rushing to the site.
What String Faults Look Like Before an Alarm
Telemetry from string faults rarely changes in a single step. Most faults develop as a gradual drift, easily lost in the usual variation from irradiance and temperature. Seeing that drift clearly helps explain why fixed thresholds often miss it.
Open-circuit faults are the clearest example. Before a string becomes fully open, series resistance often rises over an extended period, appearing as a falling current-to-irradiance ratio at a given temperature. The string still produces, but less efficiently. A failing bypass diode leaves a different pattern: string open-circuit voltage falls by a fraction tied to the affected substrings, appearing in the Vmpp reading rather than current. Connector degradation appears as an unexplained voltage drop across the termination, found by comparing expected Vmpp at a given temperature and irradiance with the actual reading.
Ground faults behave differently. They appear as current imbalance between the positive and negative rails, often beginning at very low absolute levels. If missed, they create safety and equipment risks, yet threshold-based alerting can bury them in background noise.
Why Thresholds Miss the Early Fault Window
The 20 to 30 percent drop used in most SCADA configurations is set to limit false positives. That is sensible, but the tradeoff is that the alarm waits until the fault is serious. A string operating at 85 percent of expected output for a week because of connector degradation will not alert. The loss continues unnoticed until the connection fails completely.
Temperature and irradiance normalization create a second challenge. Panels at 70 degrees Celsius produce meaningfully less current than the same panels at 25 degrees. Comparing a string at 10 AM with that same string at 2 PM in summer can look like degradation when it is simply physics. The same problem occurs when 400 W/m2 output is compared with 900 W/m2 output without normalization. Many threshold systems handle this poorly, so operations teams at many plants have learned to disregard a substantial share of their alerts.
How ML Models Tackle the Problem
At Solarvyew, we build a behavioral baseline for each string using the actual operating conditions. The model learns expected output from irradiance, taken from either a plant pyranometer or estimated through inverter DC bus data, plus ambient or module temperature. It also accounts for seasonal changes, tilt and azimuth differences across string groups, and consistent differences between inverter MPPT zones.
After the baseline is set, we follow the residual at each 15-minute interval: actual output minus expected output. Instead of using a fixed cutoff, we apply statistical process control to the residual series. A string is flagged for review when its residual begins a consistent negative drift beyond the historical variance band. The useful signal is the deviation pattern, not one isolated reading.
It is important to separate two capabilities. Finding a shift in a string's behavior is not the same as identifying the fault type. Our models can show that string 47 on inverter 12 is behaving abnormally. They cannot determine whether the cause is a degraded connector, a failing bypass diode, or localized soiling on that string group. That distinction is important when setting expectations for continuous monitoring.
What 48 Hours of Lead Time Means in Practice
Detecting a developing fault 48 hours before a full outage does not mean predicting the exact failure time. It means the behavioral shift usually becomes statistically distinguishable from normal variance roughly 24 to 72 hours before the string goes fully open-circuit or raises a SCADA alarm.
For an O&M team, that difference has real operational value. An emergency trip to a plant 200 km from the operations center costs differently from a scheduled visit. Mobilization, driving, and disruption to other planned work mean an unplanned call-out at a 30 MW plant typically costs three to five times more than a planned inspection, even when the physical task is the same. If Solarvyew flags an emerging anomaly on Monday and the team is due on site Thursday, the string can be added to Thursday's work order without extra mobilization cost.
This lead time is most useful at plants with many strings and lean O&M teams. A site with 5,000 strings and five technicians cannot respond separately to every event. Early detection helps identify which events deserve a planned response instead of a reactive one.
Building the Detection Infrastructure
This monitoring needs string-level telemetry at a useful resolution. With SCADA data aggregated into 30-minute or hourly intervals, early fault signatures are mostly lost. Fifteen-minute data is workable; five-minute data is better for inverter-level detection. String-level current is the minimum, while voltage data for each MPPT input materially improves diagnostic quality.
The irradiance reference matters just as much. A soiled or misaligned reference cell distorts the expected-output calculation, causing false positives on healthy strings or hiding genuine anomalies. We have seen plants where the pyranometer was never cleaned, creating a permanent 3 to 5 percent underestimate of expected generation. Any anomaly detection built on that reference is compromised from the outset.
During early-access work with pilot partners, a meaningful share of onboarding goes to fixing the data quality layer before the ML results are reliable enough to trust. This is not specific to our platform. It is a limitation for any analytics layer built on SCADA data.
What This Approach Does Not Replace
Continuous ML monitoring does not remove the need for physical inspection. Complete failures, hard faults, and inverter trips still produce SCADA alarms through the existing system. A string that fails suddenly instead of gradually is handled by threshold alerting as before. Continuous monitoring adds another layer by catching gradual cases that thresholds miss.
The models are not infallible either. Vegetation growth that changes shading, a new nearby structure, or an unusual clear-sky day after heavy cloud cover can create residual patterns resembling a developing fault. False positives will occur. The aim is to reduce false negatives, meaning missed faults, without raising alert volume so far that the same alert fatigue caused by threshold systems returns.
For more on how fault detection fits into an O&M tool stack, see our comparison of thermal imaging and continuous ML monitoring. The two methods address different parts of fault detection, so treating one as a replacement for the other is almost always mistaken.