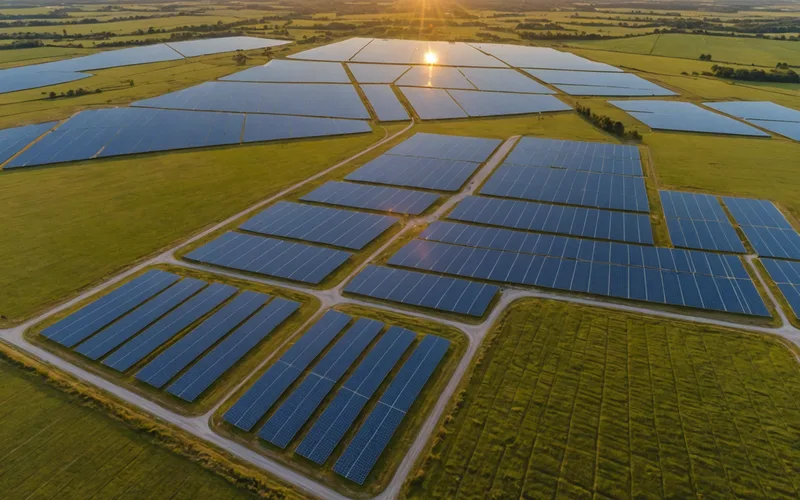
For someone managing 5 to 15 solar plants, the weekly schedule can become a cycle of SCADA logins, generation report collection, invoice reconciliation, O&M contractor follow ups, and portfolio summary preparation. Only after those tasks are complete is there time to assess plant health and decide on maintenance. The work is not a lack of data. It is the time lost moving information between systems before analysis can begin.
Solar asset management digitization does not have to start with an elaborate data platform. A more useful question is: which data signals guide your decisions, and can they reach you when needed without manual collection?
The Data Portfolio Managers Actually Use
Solar asset management has two decision layers. One is financial and contractual: does the plant meet its PPA delivery obligations, its availability guarantees, and its O&M budget? The other is operational: which plants need attention, and what response does each require?
Financial and contractual monitoring requires energy delivered per meter point for each billing period, availability calculated under the contract definition, and documented outage events with causes. These records usually sit in SCADA exports and grid interconnection meters, but still need to be extracted and formatted.
Operational monitoring calls for normalized performance by plant and inverter block, signals of developing faults, maintenance logs with costs, and equipment status. Many asset management information systems fall short here because collection alone is not enough. The data also needs ongoing analysis.
Why Multi SCADA Environments Create Information Silos
A portfolio assembled through acquisitions or over several years usually contains different SCADA setups. Plant A may use WEG inverters with a proprietary web interface. Plant B may pair SMA inverters with a Zeversolar platform. Plant C may have a custom historian that exports weekly CSVs. Formats, timestamps, and alarm logic differ across them.
The usual workaround is a spreadsheet prepared each week. A technician signs into every system, copies the figures into a template, and emails the file to the asset manager. That can support financial reporting at weekly or monthly intervals. It fails for operational monitoring, where a useful signal may remain actionable for only a few hours.
When a weekly report reveals that Plant B had an inverter underperforming by 8% in the prior week, the inexpensive response window may be gone. The inverter could have recovered, or the issue could have worsened. In either case, the decision point has passed.
Putting multi SCADA data into one operational view does not mean replacing existing SCADA systems. A data integration layer can read each API or export, align timestamps and units, and apply one performance baseline across plants. The main challenge is covering the portfolio's actual hardware with enough data connectors.
The Minimum Viable Dataset for Portfolio Insight
A SCADA historian contains more fields than asset managers need at portfolio level. For practical decisions, the minimum useful dataset for each plant is:
- Active power at inverter level, 15-minute resolution. Inverter level data is the minimum detail needed to assign underperformance to a specific block. Plant level data alone is too broad for O&M prioritization.
- POA irradiance or modeled POA from horizontal irradiance. Irradiance is required for normalized performance analysis. One pyranometer per plant is enough. Where instrumentation is unavailable, satellite derived irradiance from Solargis or POWER (NASA) is adequate for monthly analysis.
- Inverter availability status and alarm log. The alarm log records when events began and how long they lasted. That supports availability calculations and analysis of fault frequency.
- String current data, if available. This is not universal in existing plants, but is increasingly common in newer installations. String data can locate faults more precisely than inverter data alone.
- Maintenance activity log with date, technician, and activity type. Without this record, performance changes from maintenance cannot be separated from changes caused by equipment. Cleaning events especially need logging to interpret soiling trends.
Many asset managers have more data than this, but less analytical structure. Gigabytes of 1 second SCADA logs do not create operational visibility if they are never examined below the monthly summary level. The issue is data structure and analysis cadence, not volume.
From Data to Portfolio Prioritization
A functioning asset management data layer should produce a ranked list of plants needing attention and explain the type of attention each requires. That outcome is less common than portfolio reports suggest.
A standard portfolio report lists monthly generation, actual output against budget, and PR for each plant. It usually does not identify developing anomalies that have yet to affect monthly totals, recurring low severity faults hidden within the budget, or above baseline performance that indicates the baseline needs revision.
The ranking comes from continuously comparing each plant with its irradiance normalized baseline at enough resolution to catch changes within a month. For a portfolio of 10 plants, a team of 2 to 4 people cannot check this manually every day. Automation is needed.
The Practical Digitization Path
For operators relying on spreadsheets and SCADA logins, digitization works best as a sequence rather than one large platform project. First, place generation and irradiance data in one queryable store to reduce report preparation time. Next, apply one normalization method and performance baseline across the plants. Finally, automate ranking and alerts so anomalies appear without a manual search.
The first step does not need an advanced analytics platform. A structured database with consistent SCADA exports and a simple normalization script can cut weekly report time from hours to minutes and support reliable month over month comparison.
Purpose built tools such as Solarvyew become useful in the second and third steps. We normalize data from different SCADA sources, run continuous anomaly detection against each plant's historical baseline, and surface signals for O&M prioritization. This leaves the asset manager more time for decisions and less for data collection.
For context on what the operational monitoring layer detects, see our discussion of predictive versus reactive maintenance economics and our overview of early fault detection ROI.