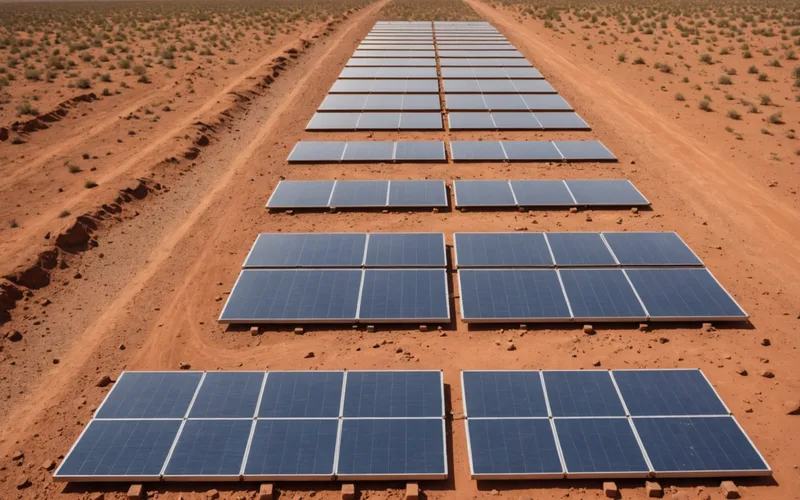
At a 3 percent soiling level, the annual impact at a large plant can be substantial. Dust, pollen, and organic matter on panel glass reduce light transmission and, with it, generation. For well-oriented panels under high irradiance conditions, each percentage point of soiling typically reduces output by 0.7 to 1 percent. A 50 MW plant in a semi-arid region producing 85,000 MWh per year could lose around 2,500 MWh annually from persistent soiling. At current commercial PV tariffs in Brazil, that is a material loss.
At a remote site, detection is only part of the challenge. Sending a technician to verify the issue and arrange a cleaning crew can cost more than the uncertainty seems to justify. Our focus has been whether generation data alone provides enough evidence to make that scheduling call with reasonable confidence.
How Soiling Appears in Generation Data
Soiling does leave a trace in telemetry. Its pattern becomes distinguishable from other loss mechanisms once the relevant signals are understood.
The clearest signal is a gradual fall in the weather-corrected performance ratio that reverses after rain or cleaning. On a PR plot normalized for irradiance and temperature, soiling looks like a slow downward drift followed by a return to baseline after precipitation. The rate varies with local dust, panel tilt, and weather. In the cerrado and caatinga regions of central Brazil, high dust deposition and dry seasons lasting four to six months can produce a substantial decline.
Generation also reveals soiling through its time-of-day profile. Because contamination scatters more light at oblique incidence, a dirty panel loses more at low sun angles than near midday. The array will therefore underperform disproportionately in the early morning and late afternoon. That pattern differs from clipping, which concentrates losses at peak irradiance, and shading, which remains spatially bounded.
Across individual strings, soiling usually appears as a similar depression throughout a geographic zone, not as isolated string anomalies. Wind-blown dust can affect an entire array section with relative uniformity. A fault is more likely to be confined to a string or inverter zone. This spatial distinction helps separate soiling from fault-related underperformance during analysis.
Limits of Remote Soiling Detection
Generation-based detection can show, with reasonable confidence, that soiling is building, estimate the loss against a clean-panel baseline, and identify the sub-arrays with the greatest deposition. It cannot reveal the layer's physical thickness or composition, or separate dust, pollen, bird droppings, and chemical deposition from nearby agriculture or industry. Those details may guide the cleaning method, but they are not required to decide when cleaning should occur.
Detection also relies heavily on a trustworthy irradiance reference. If a pyranometer or reference cell has drifted or become soiled, the expected generation calculation is compromised and the loss estimate becomes unreliable. Its condition should be checked before any detection result is accepted. This issue appears regularly at plants where reference equipment receives less maintenance attention than the production panels.
Scheduling Cleaning at Remote Sites: The Decision
Distance changes the economics of a cleaning decision. A plant within 50 km of a major city can usually bring in a crew at relatively low mobilization cost. At a plant 400 km from the nearest operations center, mobilization sets a practical minimum for an economically worthwhile cleaning event. The analytics task is to determine whether estimated soiling loss clears that threshold.
The calculation has a simple structure, although the inputs are specific to each plant. Multiply estimated soiling loss in MWh per month by the relevant energy price to find the monthly revenue impact. Then compare it with the amortized cleaning cost, including the crew day rate, travel, and water logistics for dry-region sites. If the revenue impact exceeds a meaningful portion of that cost, intervention makes economic sense. Otherwise, waiting is often preferable.
Soiling does not accumulate at a constant rate in every environment. In some regions, deposition rises quickly during the first weeks after the dry season begins, then settles into a slower plateau as the glass reaches an equilibrium soiling density. Elsewhere, accumulation continues throughout the dry season. Scheduling therefore depends on the site's deposition curve, rather than on a fixed calendar interval.
What Data Shows Between Site Visits
At a remote plant under continuous monitoring, generation telemetry serves as a proxy for site condition between visits. Tracking the soiling trend lets a team dispatch a cleaning crew based on current estimated loss instead of a fixed schedule or an expensive confirmation trip. This matters especially where dust deposition is irregular. Fixed monthly or quarterly schedules may clean too often during low-dust periods or leave major losses unresolved after high-dust events.
In early pilot-site work, we have tracked the relationship between a generation-derived soiling index and post-clean recovery measurements. The match is not perfect. The generation baseline has some uncertainty, and cleaning efficiency differs from campaign to campaign. Even so, the directional signal is consistent enough for operations: once the index passes a threshold calibrated to the site's economics, it is time to schedule a crew.
We are continuing to refine calibration for different site types and dust environments. The method does not yet provide precise soiling loss figures with tight confidence intervals. Its value is a continuous monitoring signal that fills the information gap between scheduled visits. For a remote site with long cleaning intervals, that is a meaningful improvement over having no soiling data between campaigns.
Bringing Soiling Monitoring into O&M
Soiling analysis matters only when it connects to daily operations. An alert that creates a ticket nobody reviews is no better than no alert. At Solarvyew, the goal is to connect the analytics output with the O&M team's existing work-order system. A developing trend should create a flagged maintenance item, not another notification stream that requires separate manual review.
For teams overseeing several remote sites, the portfolio view is as important as site-level detail. Which sites have the highest soiling index today? Which have worsened the most since the last cleaning? Ranking sites by estimated soiling-loss revenue impact helps direct crew routes when several sites need attention and transport must be batched. This is where continuous monitoring becomes practical O&M efficiency, rather than simply more data.